Identify relevant importers
Start with product descriptions and HS codes, then check company identity and product fit. A named importer is a research lead, not a confirmed sales opportunity.
Find importers by HS code →Research companies importing into Brazil and the suppliers behind their purchases. Inspect real company-level records, then request a sample matching your product and date range.
| Date | Importer / buyer | Exporter / supplier | HS code | Value · USD | Origin country |
|---|---|---|---|---|---|
| 2026-07-01 | STARK PROPERTIES LTDA | AGILE COURTS UNITED STATES | 84328000 | $10,797 | United States |
| 2026-07-01 | WPBG DESENVOLVIMENTO IMO… | R D RAMADON UNITED STATES | 84328000 | $3,684 | United States |
| 2026-07-01 | STIHL FERRAMENTAS MOTORIZ… | ANDREAS STIHL GERMANY | 84328000 | $23,384 | Germany |
Example import records showing company names, dates, HS codes and USD values. Request a sample matching your product and period.
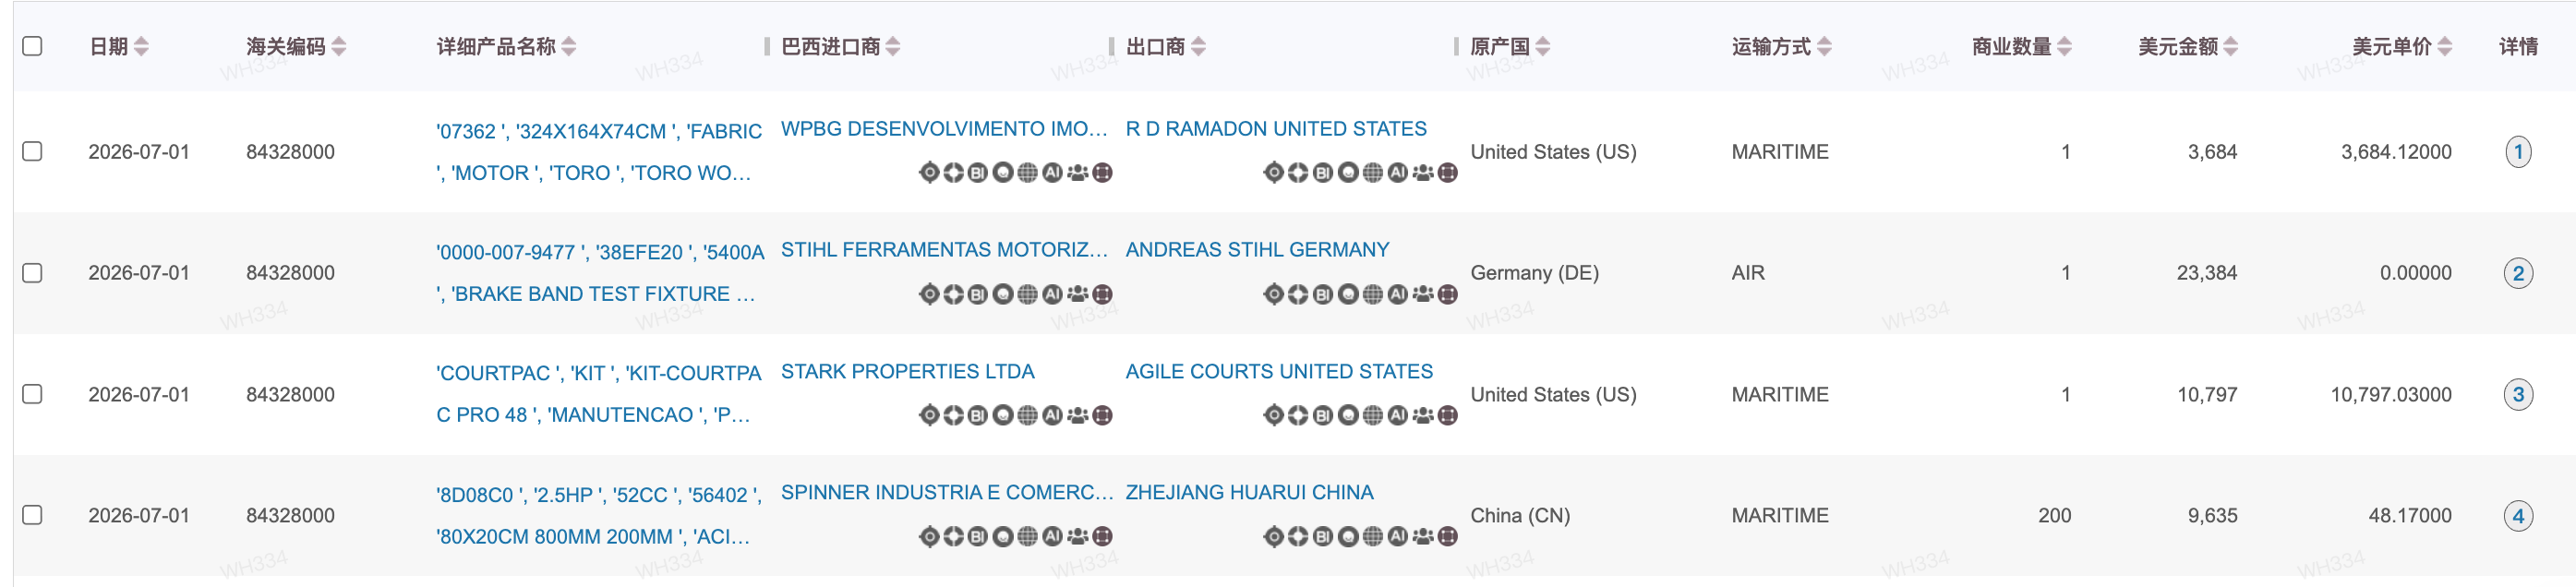
Shipment records may include consignee, shipper, value, weight and port. Available fields and transport coverage vary by source and market. This is the level a buyer list is built from.
In practice that means you can build a list of companies already importing your product into Brazil, see who supplies them now, and reach the person who signs off on purchasing.
Official import statistics declared by Brazil to the United Nations (latest complete year: 2024). Figures are total declared import value, in US dollars. The China share and the leading supplier are shown so you can see where a new supplier fits.
Statistical scope: These are four-digit HS category totals for the stated source year. They are broader than specific products such as lithium-ion batteries, solar modules or LED fixtures. Request company records for your exact product separately.
| Statistical category | HS | Import value | China incl. HK / Macao | Leading supplier |
|---|---|---|---|---|
| Semiconductor devices & photovoltaic cells | 8541 | $3.30B | 94.3% | China (93.9%) |
| Luminaires, lighting fittings & parts | 9405 | $446.2M | 88.4% | China (86.5%) |
| Soil-preparation & cultivation machinery | 8432 | $75.4M | 30.7% | China (30.6%) |
| Other furniture & parts | 9403 | $141.4M | 57.0% | China (55.8%) |
Source: UN Comtrade — national customs declarations, 2024 annual. These are the open statistics; the shipment-level records we licence go deeper, down to individual companies and individual shipments.
Beyond the coverage figures above, here is how Brazil actually shows up in the available data — the sectors, the product groups and the supply role.
We licence shipment-level records from 98 countries and cover 230+ countries and territories in total. Product descriptions with specifications, models and packaging are available for 45+ countries; company standing and ownership data covers 220 countries.
Contact details come through LinkedIn Sales Navigator for professional company and purchasing-role research, and company standing comes from licensed D&B data. We do not supply private mobile numbers or personal email addresses.
Start with product descriptions and HS codes, then check company identity and product fit. A named importer is a research lead, not a confirmed sales opportunity.
Find importers by HS code →Inspect the exporter or supplier in each record. Check related entities and logistics roles before deciding how to approach the importer.
Research company suppliers →Request records for your product, target market and preferred period.
Tell us your product and target market. We will confirm available fields and dates, then share relevant record screenshots or arrange a demonstration.